Step One Life · AU · Jul–Aug 2026
Replacing the text menu
with product imagery
The mobile menu was a text list for a product chosen by colour and style. An image-led menu lifted add-to-cart significantly and conversion with it — while clickthrough fell significantly, the signature of a shorter path, not a weaker one.
conversion rate
add-to-cart rate — statistically significant
clickthrough — significant, and correctly read as navigation efficiency
revenue over the read window
Contents
01The Problem
The mobile menu was a text list. For a product where colour and style drive the choice, asking mobile shoppers to navigate by reading category names was friction at the exact point where most of the traffic sits.
Hypothesis: if the mobile menu is rebuilt as a visual, image-led navigation showing product imagery, users will find what they're looking for more easily and convert quicker.
02The Change
One surface, mobile only: the mobile navigation was redesigned from a vertical text list into an image-led product grid across both Men's and Women's collections.
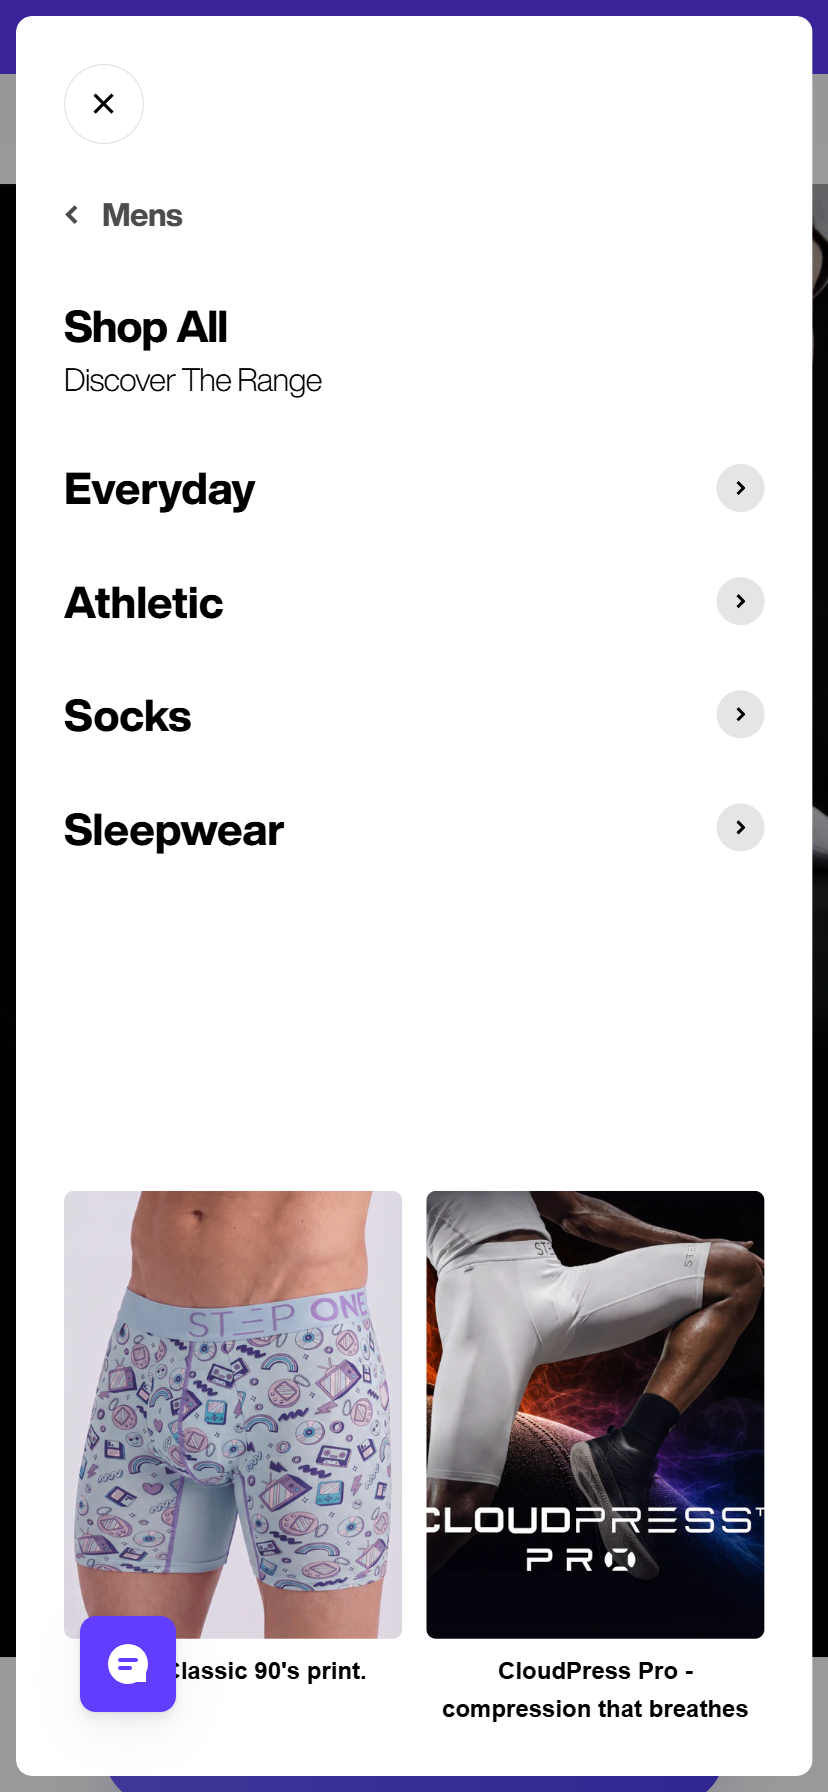
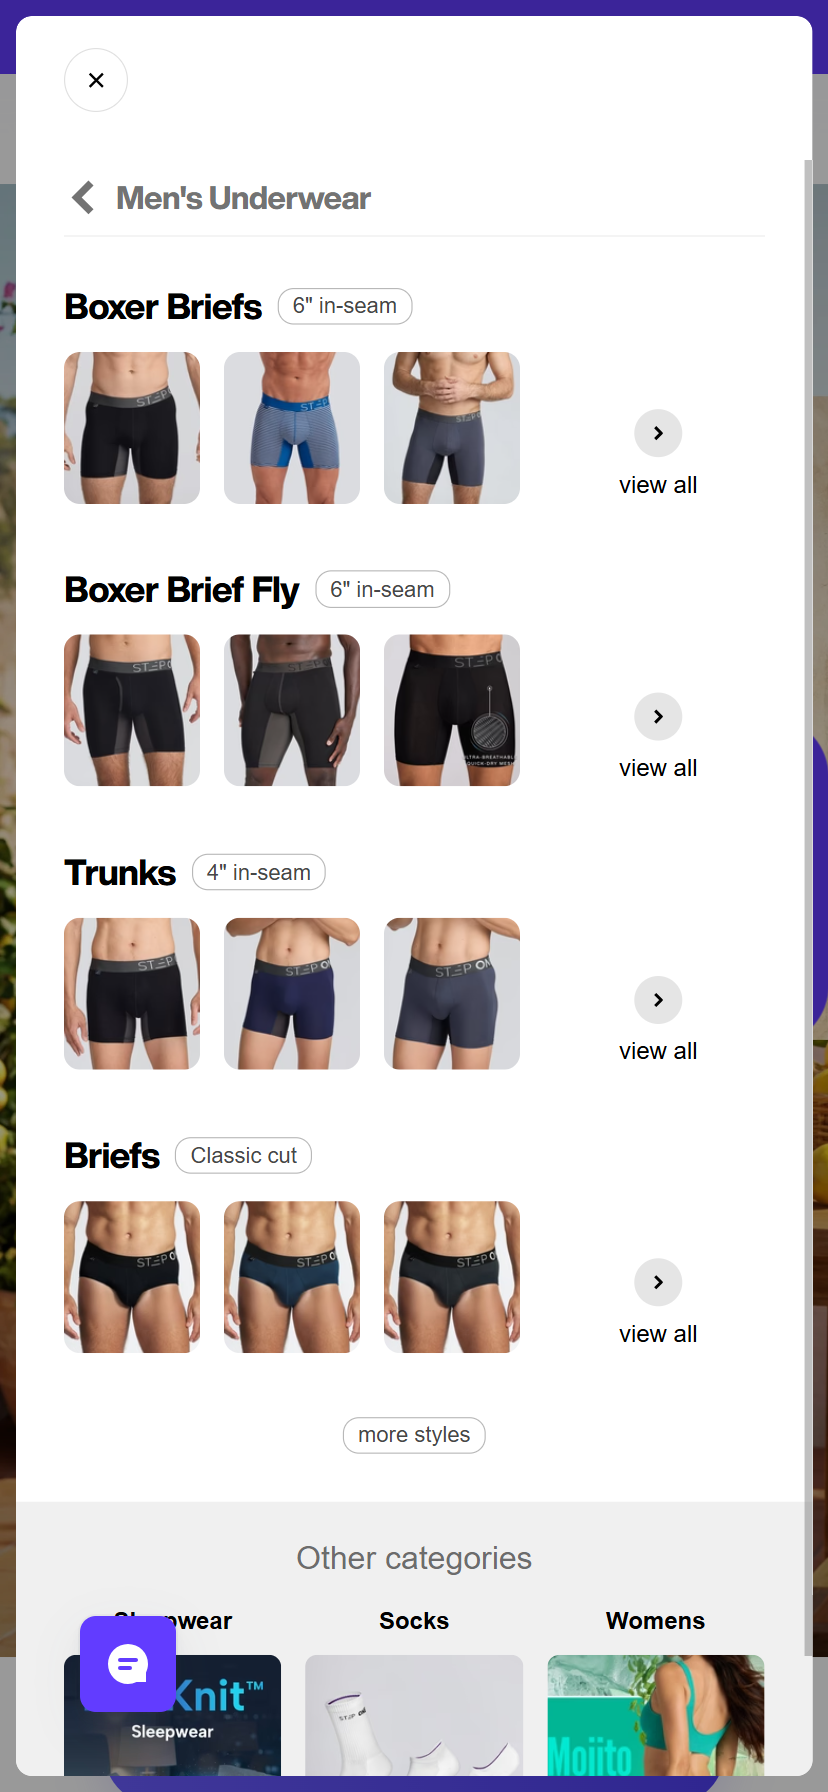
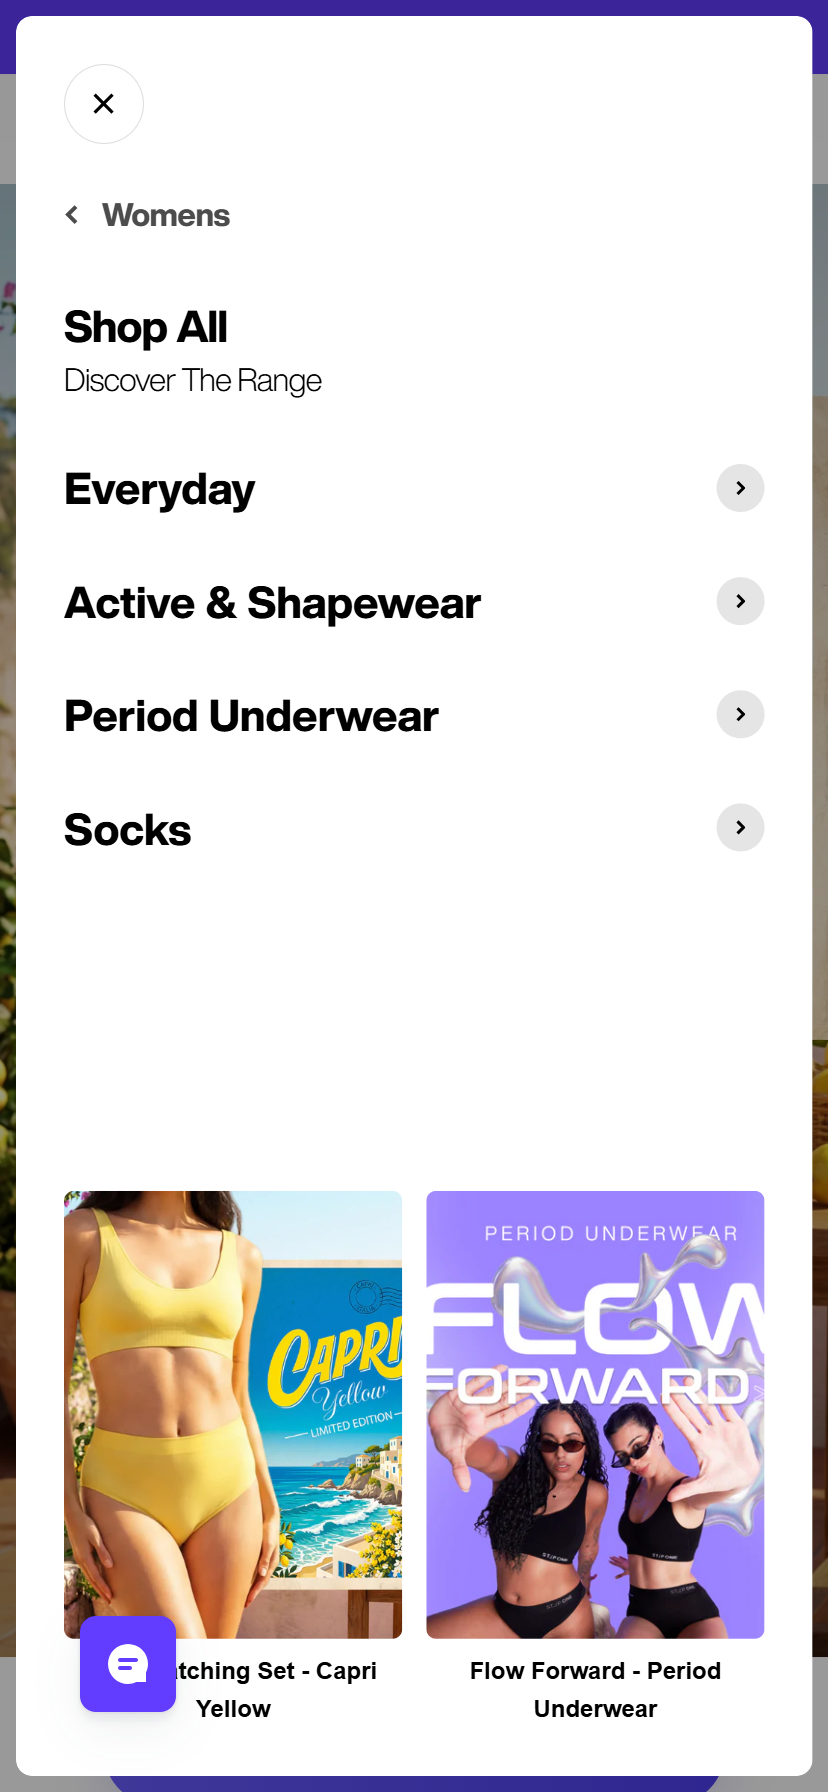
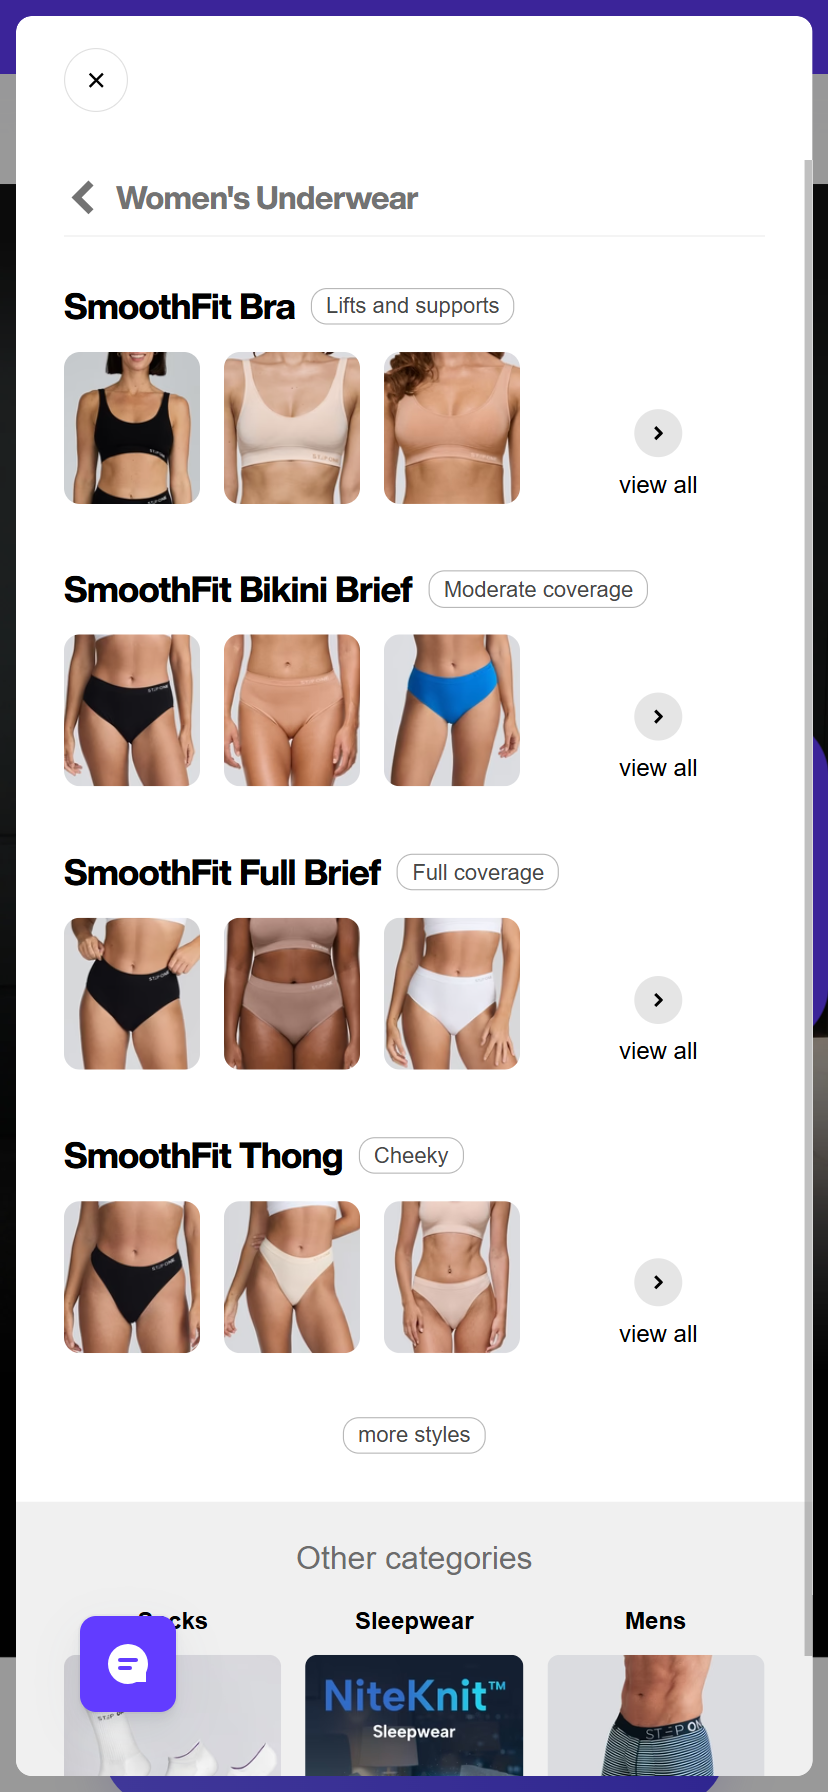
Instead of requiring shoppers to read text category labels ("Boxer Briefs", "Trunks", "Bikini Briefs"), the variant introduced visual tiles displaying product silhouettes, cuts, and key colourways. This allowed users to visually pre-qualify products directly from the menu before loading a collection or PDP.
03Results
~67k visitors, evenly split, over the read window:
| Metric | Change |
|---|---|
| Conversion rate | +5.1% |
| Add-to-cart rate | +4.6% significant |
| Clickthrough rate | −6.7% significant |
| Revenue per visitor | +2.4% |
| Orders | +4.3% |
| Revenue | +2.3% |
New visitors — the large majority of traffic — showed a clean win across every metric. Discount-code usage was checked as a confound and ruled out (usage was essentially identical across both arms).
04Reading the CTR Drop Correctly
The clickthrough decline is the number that looks alarming in a dashboard and isn't. It is consistent with visitors navigating more directly to product — seeing the item in the menu image and going straight to it — rather than click-hopping through text categories. The deciding evidence: add-to-cart rose significantly in the same direction as the CTR fell, and conversion followed. A CTR drop with stable or rising ATC is navigation efficiency; a CTR drop with falling ATC is disengagement. This was the former.
05The Honest Timeline
The day-11 wrap called it correctly: ATC significantly up, CVR directionally up but not yet significant — continue the test, do not roll out yet. The experiment log records the variant as the final winner. Two channels were flagged as watch items through the run: Paid Social (RPV −19.0%) and SMS (RPV −14.4%), both on small samples, both worth a look before assuming the win travels to paid traffic.
06Key Insight
Merchandising belongs in navigation. For a visually-chosen product, an image-led menu shortens the path to the right PDP — and a clickthrough decline can be the signature of a shorter path, not a weaker one.
Source: Shoplift experiment report AU_Theme_CVR_260723, Step One AU storefront, 23 Jul – 3 Aug 2026. Interim wrap at day 11; the experiment log records the variant as the final winner. All figures traceable to the named experiment ID.